- Getting the Skeleton Files
- Introduction
Percolation.javaPercolationStats.java- Runtime Analysis (Ungraded)
- Provided Files
- Submission
- FAQ
- What should
stddev()return if T equals 1? - After the system has percolated,
PercolationVisualizercolors in light blue all sites connected to open sites on the bottom (in addition to those connected to open sites on the top). Is this “backwash” acceptable? - How do I generate a site uniformly at random among all blocked sites for use in
PercolationStats? - I don’t get reliable timing information in
PercolationStatswhen N = 200. What should I do? - I’m failing the Chi Squared test but passing everything else.
- It’s telling me that my code reports “false” for
percolates()but when I run the visualizer I’m getting true! - My code is compiling on my computer but not on the autograder.
- What should
- Credits
Getting the Skeleton Files
As usual, run git pull skeleton master to get the skeleton files. If you are using IntelliJ, you must import the project at the outer ‘hw2’ directory level (not the ‘hw2’ directory within the ‘hw2’ directory). Otherwise, you will get an error with the packages!
Introduction
In this program, we’ll write a program to estimate the value of the percolation threshold via Monte Carlo simulation. You will be using a disjoint sets implementation provided as part of the Princeton standard library. You will not be implementing disjoint sets for this homework, as this has already been done for you in the library.
Introductory Video. An introductory video for this HW can be found at this link. It is broken into three parts: Intro, Implementation Spoilers, and Optimization Spoilers. Feel free to ignore these spoilers for a more difficult challenge. If you’d prefer to watch a four year old video I made when I was at Princeton, see this link.
HW2 Slides. Slides for this HW can be found here. Because this is a HW and not a project, I give spoilers for how to approach the HW. You may ignore them if you’d like a bigger challenge.
Percolation. Given a composite systems comprised of randomly distributed insulating and metallic materials: what fraction of the materials need to be metallic so that the composite system is an electrical conductor? Given a porous landscape with water on the surface (or oil below), under what conditions will the water be able to drain through to the bottom (or the oil to gush through to the surface)? Scientists have defined an abstract process known as percolation to model such situations.
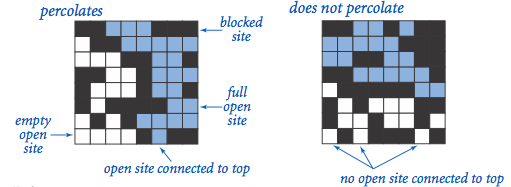
The model. We model a percolation system using an N-by-N grid of sites. Each site is either open or blocked. A full site is an open site that can be connected to an open site in the top row via a chain of neighboring (left, right, up, down) open sites. We say the system percolates if there is a full site in the bottom row. In other words, a system percolates if we fill all open sites connected to the top row and that process fills some open site on the bottom row. (For the insulating/metallic materials example, the open sites correspond to metallic materials, so that a system that percolates has a metallic path from top to bottom, with full sites conducting. For the porous substance example, the open sites correspond to empty space through which water might flow, so that a system that percolates lets water fill open sites, flowing from top to bottom.)
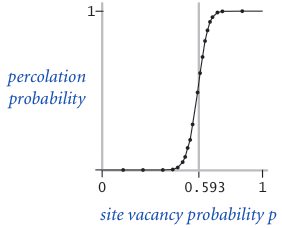
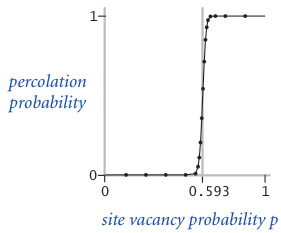
The problem. In a famous scientific problem, researchers are interested in the following question: if sites are independently set to be open with probability p (and therefore blocked with probability 1 − p), what is the probability that the system percolates? When p equals 0, the system does not percolate; when p equals 1, the system percolates. The plots below show the site vacancy probability p versus the percolation probability for 20-by-20 random grid (top) and 100-by-100 random grid (bottom).
When $N$ is sufficiently large, there is a threshold value $p^*$ such that when $p < p^*$ a random N-by-N grid almost never percolates, and when $p > p^*$, a random N-by-N grid almost always percolates. No mathematical solution for determining the percolation threshold $p^*$ has yet been derived. Your task is to write a computer program to estimate $p^*$.
Percolation.java
Percolation data type. To model a percolation system, create a data type in the hw2 package named Percolation with the following API:
public class Percolation {
   public Percolation(int N)                // create N-by-N grid, with all sites initially blocked
   public void open(int row, int col)       // open the site (row, col) if it is not open already
   public boolean isOpen(int row, int col)  // is the site (row, col) open?
   public boolean isFull(int row, int col)  // is the site (row, col) full?
   public int numberOfOpenSites()           // number of open sites
   public boolean percolates()              // does the system percolate?
   public static void main(String[] args)   // use for unit testing (not required)
}
Corner cases. By convention, the row and column indices are integers between 0 and N − 1, where (0, 0) is the upper-left site: Throw a java.lang.IndexOutOfBoundsException if any argument to open(), isOpen(), or isFull() is outside its prescribed range. The constructor should throw a java.lang.IllegalArgumentException if N ≤ 0.
Performance requirements. The constructor should take time proportional to $N^2$; all methods should take constant time plus a constant number of calls to the union-find methods union(), find(), connected(), and count(). Meeting these requirements is somewhat tricky! You might consider creating a solution that simply works, before figuring out a way to make it faster. For tips on meeting the speed requirements, see the video at the beginning of this spec. Your numberOfOpenSites() method must take constant time. Your code must use the WeightedQuickUnionUF class! Do not reimplement the Union Find ADT. Part of the goal of this assignment is to learn how to cast one problem (Percolation) in terms of an already solved problem (Disjoint Sets, a.k.a Union Find).
PercolationStats.java
Monte Carlo simulation. To estimate the percolation threshold, consider the following computational experiment:
- Initialize all sites to be blocked.
- Repeat the following until the system percolates:
- Choose a site uniformly at random among all blocked sites.
- Open the site.
- The fraction of sites that are opened when the system percolates provides an estimate of the percolation threshold.
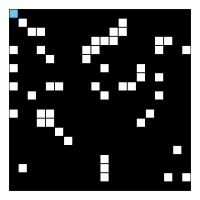
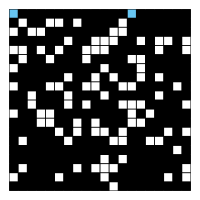
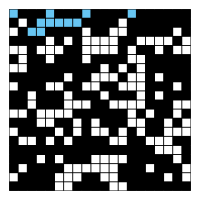
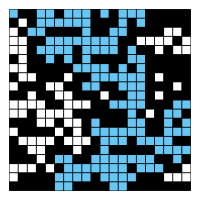
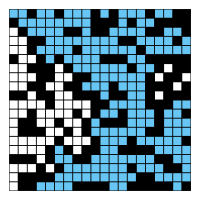
For example, if sites are opened in a 20-by-20 grid according to the snapshots below, then our estimate of the percolation threshold is 204/400 = 0.51 because the system percolates when the 204th site is opened. The images correspond to the 50, 100, 150, and 204 sites being open, respectively.
By repeating this computation experiment $T$ times and averaging the results, we obtain a more accurate estimate of the percolation threshold. Let $x_t$ be the fraction of open sites in computational experiment $t$. The sample mean $\mu$ provides an estimate of the percolation threshold; the sample standard deviation $\sigma$ measures the sharpness of the threshold.
$\mu = \frac{x_1 + x_2 + … + x_T}{T}$, $\sigma^2 = \frac{(x_1 - \mu)^2 + (x_2 - \mu)^2 + … + (x_T - \mu)^2}{T-1}$
Assuming $T$ is sufficiently large (say, at least 30), the following provides a 95% confidence interval for the percolation threshold:
$[\mu - \frac{1.96\sigma}{\sqrt{T}}, \mu + \frac{1.96\sigma}{\sqrt{T}}]$
To perform a series of computational experiments, create a data type in the hw2 package named PercolationStats with the following API:
public class PercolationStats {
   public PercolationStats(int N, int T, PercolationFactory pf)   // perform T independent experiments on an N-by-N grid
   public double mean()                                           // sample mean of percolation threshold
   public double stddev()                                         // sample standard deviation of percolation threshold
   public double confidenceLow()                                  // low endpoint of 95% confidence interval
   public double confidenceHigh()                                 // high endpoint of 95% confidence interval
}
The constructor should throw a java.lang.IllegalArgumentException if either N ≤ 0 or T ≤ 0.
The constructor should take three arguments N, T, and pf, and perform T independent computational experiments (discussed above) on an N-by-N grid. Using this experimental data, it should calculate the mean, standard deviation, and the 95% confidence interval for the percolation threshold.
For this portion of the HW assignment, you must use the PercolationFactory object pf to create new Percolation objects. You should never call new Percolation(N) directly in PercolationStats, for this will mess up autograder testing. Using the PercolationFactory object will allow us to use your PercolationStats implementation with the solution Percolation implementation to avoid cascading errors.
In addition, you must use edu.princeton.cs.introcs.StdRandom to generate random numbers because our testing suite relies on this library. You should use edu.princeton.cs.introcs.StdStats to compute the sample mean and standard deviation, but if you’d prefer, you’re welcome to write your own functions to compute statistics.
Runtime Analysis (Ungraded)
This part of the HW will not be graded, but it is highly recommended that you at least read though and think about the following points:
-
Implement the
Percolationdata type using the quick-find algorithm in QuickFindUF. Use Stopwatch to measure the total running time ofPercolationStatsfor various values ofNandT. How does doublingNaffect the total running time? How does doublingTaffect the total running time? (Edit: An earlier version of this assignment mentioned tilde notation which was removed in the 2018 version of the course). -
Now, implement the
Percolationdata type using the weighted quick-union algorithm in WeightedQuickUnionUF. Answer the same questions in the previous bullet.
Provided Files
We provide two clients that serve as large-scale visual traces. We highly recommend using them for testing and debugging your Percolation implementation.
Interactive Visualization client. InteractivePercolationVisualizer.java animates the results of opening sites in a percolation system, using the mouse as input. It takes a command-line integer N that specifies the grid size. As a bonus, it prints out the sequence of sites opened in the same format used by PercolationVisualizer (described below), so you can use it to prepare interesting files for testing. If you design an interesting data file, feel free to share it in the discussion forums.
File-Based Visualization client. PercolationVisualizer.java is similar to the first test client except that the input comes from a file (instead of mouse clicks). It visualizes by performing the following steps:
- Read the grid size N from the file.
- Create an N-by-N grid of sites (initially all blocked).
- Read in a sequence of sites (row i, column j) to open from the file. After each site is opened, draw full sites in light blue, open sites (that aren’t full) in white, and blocked sites in black using standard draw, with site (0, 0) in the upper left-hand corner.
For the input file, input20.txt, the program should produce output as shown in the following images. The images correspond to the 50, 100, 150, 204, and 250 sites being open, respectively.
You can run the visualizer on this input by passing in inputFiles/input20.txt to the IntelliJ program’s Edit Configurations... tab.
Sample data files. The inputFiles directory contains some sample files for use with the visualization client, including the input20.txt that we saw above. Associated with each input .txt file is an output .png file that contains the desired graphical output at the end of the visualization.
Submission
You should submit the usual way, by pushing to GitHub and then submitting on Gradescope.
FAQ
What should stddev() return if T equals 1?
The sample standard deviation is undefined. We recommend returning Double.NaN but we will not test this case.
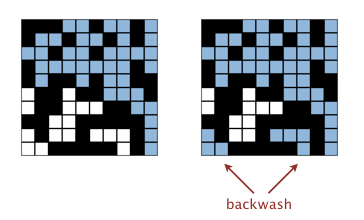
After the system has percolated, PercolationVisualizer colors in light blue all sites connected to open sites on the bottom (in addition to those connected to open sites on the top). Is this “backwash” acceptable?
While allowing backwash does not strictly conform to the Percolation API, it requires quite a bit of ingenuity to fix and it leads to only a small deduction if you don’t.
How do I generate a site uniformly at random among all blocked sites for use in PercolationStats?
Pick a site at random (by using StdRandom or some other library to generate two integers between 0 (inclusive) and N (exclusive) and use this site if it is blocked; if not, repeat.
I don’t get reliable timing information in PercolationStats when N = 200. What should I do?
Increase the size of N (say to 400, 800, and 1600), until the mean running time exceeds its standard deviation.
I’m failing the Chi Squared test but passing everything else.
The issue is that you’re using the same random seed for multiple simulations, and the statistical test is catching the fact that they are the same.
If you look at the code for StdRandom, you’ll see that it sets the seed just once (the first time StdRandom is used), which prevents this issue of seed reset. In short, don’t set the seed yourself.
Alternately, make sure you’re not generating biased random numbers. You should be using the StdRandom method that generates integers, not doubles.
It’s telling me that my code reports “false” for percolates() but when I run the visualizer I’m getting true!
The visualizer does a very specific sequence of isOpen()/isFull()/percolates() calls. Try creating your own test that only opens sites and then calls percolates(). Alternately, disable all isOpen() and/or isFull() calls in the visualizer so you can focus on the percolates() behavior. Alternately, pay close attention to the test labeled Random Operation Order.
My code is compiling on my computer but not on the autograder.
Your code must obey the API exactly. You may not add additional public methods or variables to the Percolation class. When we test your PercolationStats, we use a reference version of Percolation instead of your version to avoid cascading errors – which means you can’t assume that any additional public methods are available.
Credits
This assignment originally developed by Kevin Wayne and Bob Sedgewick at Princeton University, with autograder built by Josh Hug for the Princeton Algorithms course.